
@iau-wgsn.bsky.social
BlueSky - our IAU edu infos
Please Contact Us
Channel
@iau-wgsn.bsky.social
BlueSky - our IAU edu infos
Please Contact Us
Channel
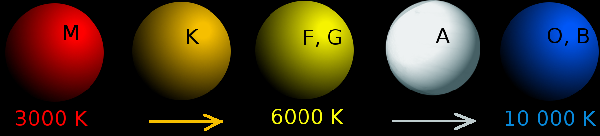
stars may have many colours: blue, white, yellow, orange, red… even with the naked eye you can distinguish the colours – at least for bright stars.
This visual impression gives a directly clue concerning the surface temperature of the star.
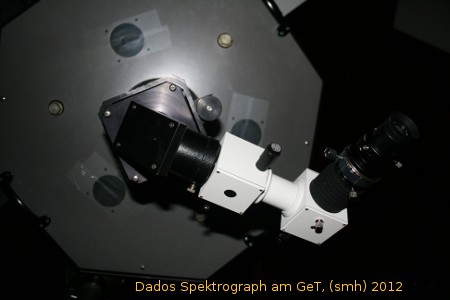
The Dados spectrograph from Baader Planetarium is very suitable for observing the systematics of star classification. Simply connect it to a telescope and you can easily see a star spectrum visually or record it with an electronic eyepiece (or webcam).
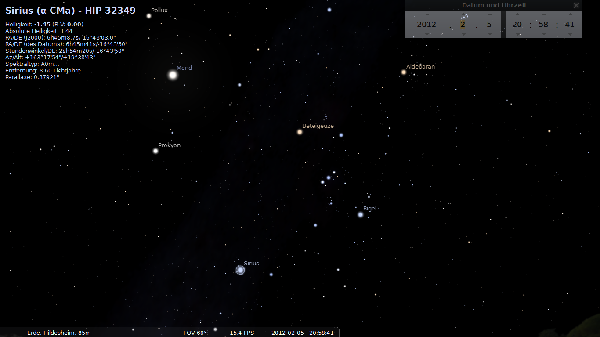
If you now want to record a spectral atlas, it is best to make a clear program before an observation evening, i.e. think in advance about which stars you want to spectroscope. To do this, choose a planetarium software program and see which stars are above the horizon on the evening in question.
Stellarium is a very popular freeware that is suitable for this at first, but CAUTION many star charts unfortunately contain errors! It is therefore best to look up all the stars again in the professional Simbad database.
As an alternative to Stellarium, you can also use the somewhat more professional, better planetarium freeware Cartes du Ciel.
With the MaxIm DL astronomy software, you can check the image capture on the telescope and also evaluate it immediately. You simply draw a rectangular box over the recorded spectrum and then have the pixel brightnesses output as a numerical value.
The resulting csv files can be output as graphs using a standard spreadsheet program.
Calibrating numerous spectra for an atlas
The somewhat more convenient method is to use the rspec software to generate the spectra. Here it is relatively easy to calibrate the spectra recorded using the same method by manually assigning prominent lines in a star spectrum. For all other stars taken on the same day with the same position of the spectrograph, the lines are of course in the same position.
Here are two examples: blue a reference spectrum, red the section of our recorded spectrum.
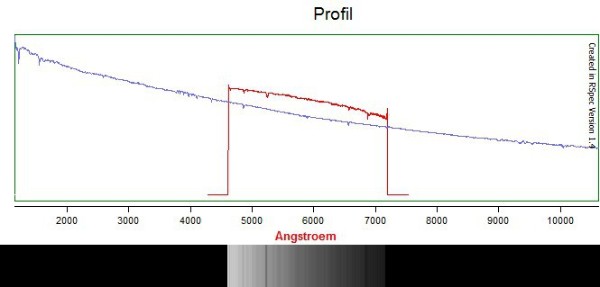
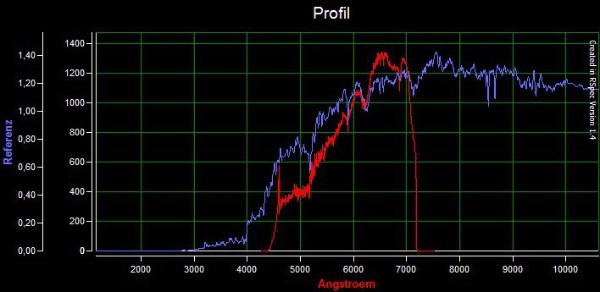
You can clearly see that the continuum of the early type (O star) is relatively smooth and has only a few absorption lines. The cooler K star, however, has a very jagged spectrum with numerous deep and broad lines.
In addition, you can see that the radiation maximum of the K star is clearly at redder wavelengths, namely here at about 7000 Angstroms, while the maximum of the O star on the left appears to be outside the diagram, i.e. at much shorter wavelengths, beyond the visible.
With this very simple method (suitable for schools) you can already understand the simple spectral and luminosity classification of stars.
THANK YOU
These images were taken at the Marienburg Observatory together with Dr. Arndt Latußeck and one of his students. The pupil and my students have analyzed this data and have written their own papers.
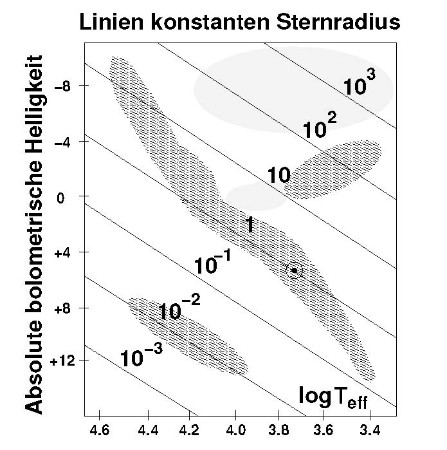
If such a spectrum is recorded from an open star cluster, the result is a color-brightness diagram (or Hertzsprung-Russell diagram).
As the stars in an open star cluster are formed at the same time, but are different in size, heat and mass, the distribution of the stars in the FHD/ HRD shows the age of the star cluster. The massive stars age faster than the more common low-mass stars. The position of the “kink point” of the main sequence of an open star cluster in the FHD/ HRD reveals its age.
Task: Explore the Hertzsprung-Russell diagram!
Where are the ordinary sun-like stars (and where is the sun itself), where are the particularly young and the particularly old stars? Enter it in this sketch.
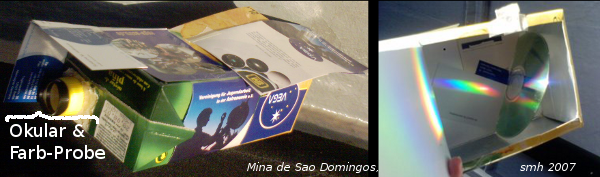
You can build your own spectroscope with a normal CD. You can even see the strongest lines in the solar spectrum and follow in the footsteps of Joseph von Fraunhofer:
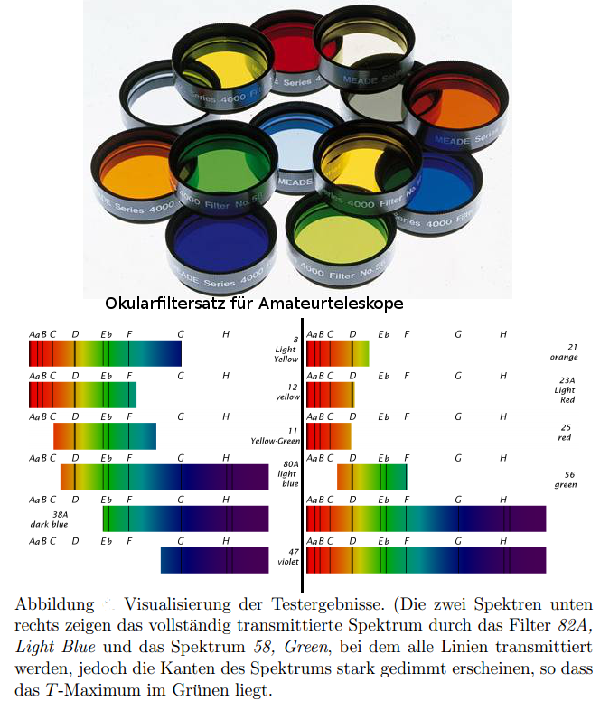
build yourself a slit-aperture device and place different colored glasses in front of the slit. With your CD grating spectroscope, you can observe which colors are transmitted by the colored glasses. The dark lines of the solar spectrum serve as reference points, i.e. as a natural scale: Because they lie at certain wavelengths, you can later say exactly which wavelengths are transmitted by the colored glasses.
© 2025All Rights Reserved, Safari WordPress Theme