
@iau-wgsn.bsky.social
BlueSky - our IAU edu infos
Please Contact Us
Channel
@iau-wgsn.bsky.social
BlueSky - our IAU edu infos
Please Contact Us
Channel
Magnetic fields can be measured by using the movement of electric charges. A charge current creates a magnetic field that counteracts its cause (Lenz’s rule) and since we know this magnetic field precisely (because we control the movement of the charge carriers), we can use it to register a surrounding external magnetic field.
We cannot easily get out of the earth’s magnetic field. But how big is it actually?
Task: Measure the Earth’s magnetic field using method 1 and method 2 and compare the results!
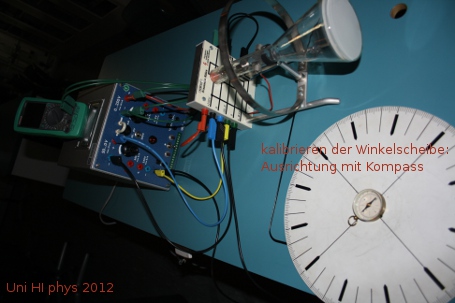
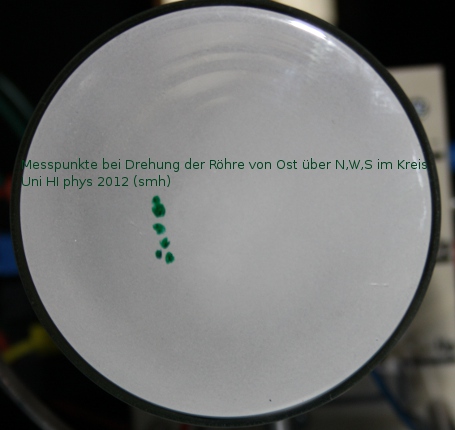
From the resulting scattering (right), we computed the magnetic field of the Earth: 0.5 Gauß.
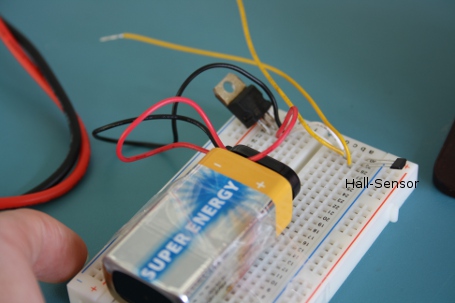
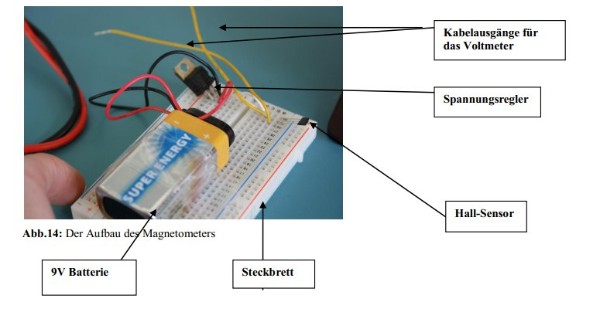
A magnetometer has been made with a simple construction (component for 21 € at CONRAD): A current is sent through the small black Hall sensor, which comes from the battery (throttled with a series resistor). The Hall voltage can be measured, the Hall constant can be taken from data sheets/charts. An external magnetic field can therefore be determined from the measured transverse voltage (or current).
The earth’s magnetic field can at least be estimated using this method; the accuracy of the measurement does not provide more than the correct order of magnitude.
If you can’t see the auroras (e.g. because of clouds), you can hear them!
Every radio amateur knows that it works: You can observe auroras with a radio or radio receiver: Such a simple radio receiver, which anyone can build – even without an amateur radio license – you can make the changes in the reflection properties of the ionosphere for radio waves audible through the solar particle stream!
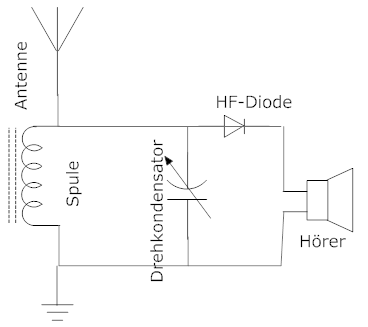
CONRAD has a fun kit for a shortwave radio: Link. But you can also build a medium wave radio with a few simple components:
simple medium wave receiver – The capacitor should be adjustable in the range from 0 to 500 pF, a long wire is sufficient as an antenna and about 100 turns of copper wire on a roll of toilet paper as a coil (you can always put an iron core in it).
If you want to measure the magnetic field of other celestial bodies, these methods are of course beyond the school budget, both in terms of money and time resources: unfortunately, we cannot fly to Mars with a Braun tube and carry out this measurement.
However, auroras can also be observed on other celestial bodies.
Task: Search the Internet (e.g. NASA) for photos of auroras that have been photographed by space probes on other planets. What do these lights show when you look at them from space?
a) Consider their position on the planet (are they closer to the pole or the equator) and describe their shape. Where is the magnetic pole in the picture? Does it correspond to the rotation pole? (Hint: The cloud bands on the gas planets are parallel to the equator, so you can see the position of the rotation pole from this).
b) Are there auroras on Venus? – Give reasons for your answer!
The sun does not have a static magnetic field like the planets, but a very dynamic one. The magnetic field lines are physically connected to the hot gas (plasma) of the solar atmosphere and therefore rotate with the material. However, the solar surface does not rotate at the same speed everywhere (as with rigid bodies, e.g. the Earth), but the solar surface rotates faster at the equator than at the poles (differential rotation). As a result, the magnetic field lines from the equator “overtake” the others that are closer to the poles and become more and more twisted.
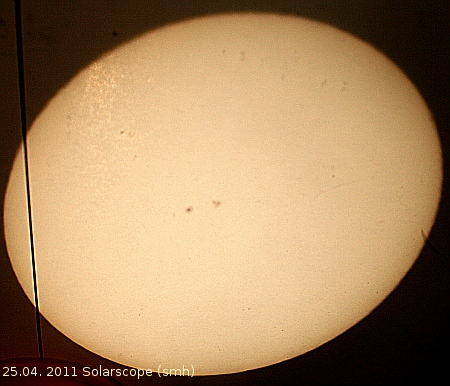
The visual effect is caused by the fact that at “nodes” of the magnetic field the hot material from deep layers of the sun can no longer reach the surface as well and a (seemingly darker) spot is created.
In the sunspot, the surface temperature is only approx. 4000-5000 K and therefore 1000-2000 K cooler than the normal surface temperature of the sun of approx. 6000 K. So although this spot is still hot (i.e. bright), it is somewhat cooler in relation to its surroundings and therefore darker.
Approximately every eleven years, the sun’s magnetic field, which is twisted in many places, collapses and all sunspots disappear. It then rebuilds with the polarity reversed and the game begins again.
The magnetic field of a sunspot can be measured by splitting spectral lines using the Zeeman effect.
Zeeman effect in the laboratory
Zeeman splitting of the Fe lines of the sun (measured at the Einstein Tower in Potsdam)
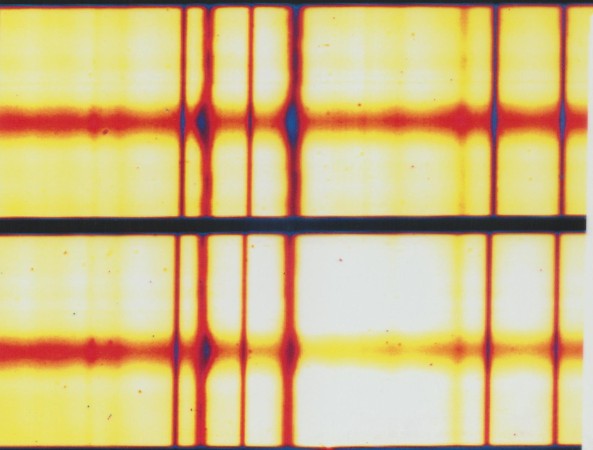
Splitting of a spectral line, measured in a sunspot
The picture shown here was taken by me during an astrophysical practical course in Potsdam.
(I led this seminar from 2001-2004, so there was plenty of opportunity: unfortunately the Potsdam weather was not always kind to us, but it did work out once).
Task: Save the image and measure the width of the split in pixels.
The two unsplit lines are the oxygen lines of the earth’s atmosphere. They are assigned the wavelengths 630.20 nm and 630.27 nm.
As the distance between the O2 lines is well known from laboratory measurements, you can also measure them in pixels and deduce how large the splitting is in typical units of wavelength (nm or angstroms).
Reference (for comparison): Between them is the iron line 630.25 nm and next to the trio we find Fe 630.151; both in the solar spectrum.
You can use this to calculate the magnetic field strength using the familiar Zeeman splitting formula.
Task: How do you explain the broadening of solar lines compared to terrestrial lines? Which physical quantities – apart from magnetic fields – have a broadening effect on spectral lines?
Measuring device: The Einstein Tower on Potsdam’s Telegrafenberg
The tower is still used today by solar physicists and is therefore only open to the public to a limited extent. Visits can be booked via the Urania Potsdam.
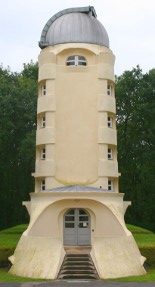
How it works: Light enters through the dome.
Two plane mirrors direct it into the tower.
The so-called coelostat (large image below): Light is first reflected onto the mirror at the bottom right and from this onto the one at the top left.
There it falls through a lens (inlay image on the left), which is adjustable for focusing.
In the basement of the tower (top right), the image of the sun arrives at a gap in the wall after a further deflection (the photograph of the sun is now in front of it):
Behind it, in a well-tempered room, is a sensitive spectrograph. Its results were then analyzed in the past with a book (= “Tafelwerk der Spektrallinien”) and today with a computer.

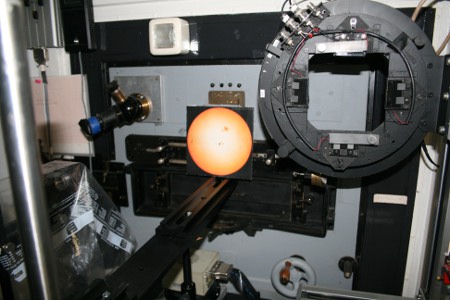
In the basement laboratory, the light from the sun can also be projected and generate a large image of the sun. Alternatively, it is directed through the slit into the spectrograph (etalon), which is covered here by a small solar image avatar.
© 2025All Rights Reserved, Safari WordPress Theme